Shark Habitat Prediction
SoloNov 2025 – Dec 2025View code
- 19,279 → 4,752
- raw ARGOS pings reduced to standardised daily positions
- 77.8% vs 70.2%
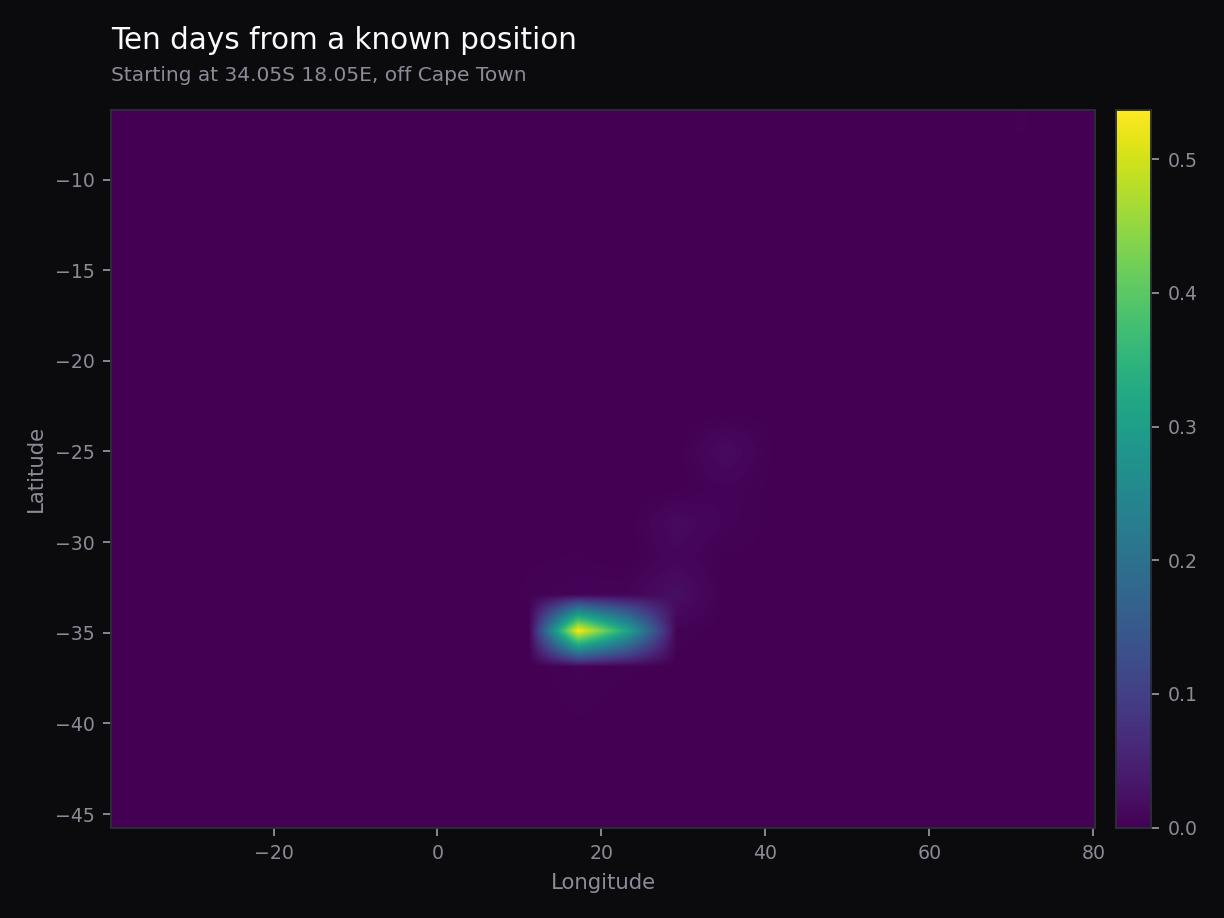
- 10-day top-5 hit rate for the model versus persistence
- 82.9% vs 83.8%
- one-day top-1 hit rate: statistically tied with persistence
The problem
Satellite tags on great white sharks emit irregular ARGOS pings: uneven in time, noisy in position, and clustered wherever a fin happened to break the surface. The question was whether that mess supports a forecast that beats simply assuming the shark stays where it was last seen.
Approach
- Standardised 19,279 raw ARGOS pings into 4,752 daily positions, because a transition model needs a regular time step and the raw feed does not have one.
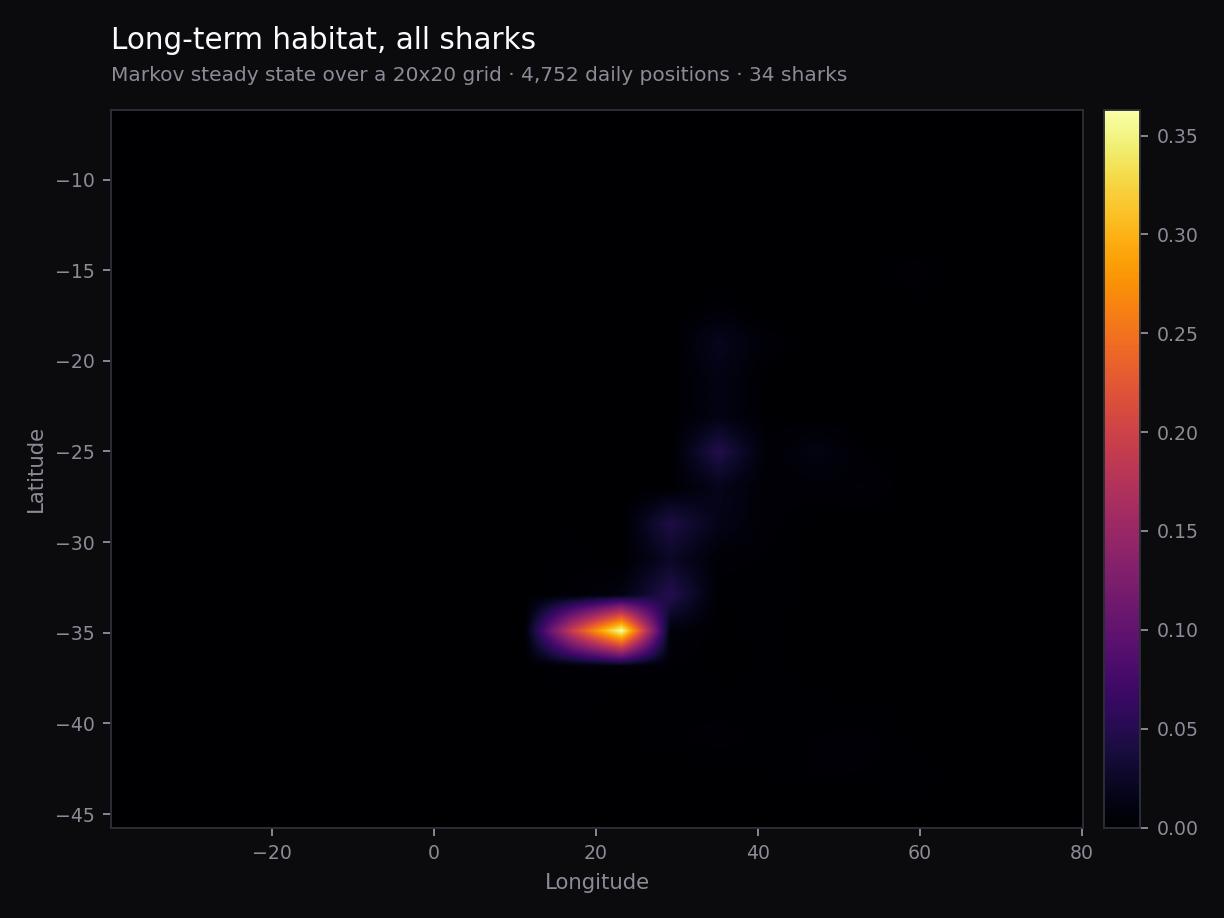
- Discretised the ocean into a 20 x 20 grid and built a corrected transition matrix using only observations genuinely one day apart; 27% of consecutive rows had multi-day coverage gaps that the original notebook had treated as one-day moves.
- Held out each of 34 sharks' final 20% of observations by date, then scored forecasts at 1, 7 and 10 days against persistence, uniform and empirical-marginal baselines.
- Repeated the evaluation by demographic subgroup and treated the adult-female render as a single animal's track, not a population estimate, because the dataset contains only one tagged adult female.
Why the baseline matters more than the raw hit rate
The grid cells cover roughly 220 by 600 km, so a high cell hit rate can mostly reflect coarse geography. The meaningful result is the comparison on identical held-out pairs: the Markov model ties persistence at one day, then pulls ahead modestly at seven and ten days. The original long-horizon heatmap is also illustrative rather than validated because it used row 0 of P¹⁰⁰, not a properly estimated steady-state vector.
Stack
- NumPy
- Markov chains
- Matplotlib